


How is the UK’s Regional Office Market Performing in 2022?
After two years of uncertainty and upheaval caused by the COVID-19 pandemic, the UK regional office market has regained footing in the new, changed working world. Each regional locale is experiencing different conditions, with some faring better than others, making it essential to be aware of key regional variations.
In this article, we assess the overall performance of the regional office market in recent times, whilst also looking into the factors that have defined this market throughout 2022. We’ve generated our insights from the latest data out of market leading sources, such as CBRE, Savills, Avison Young, and Cushman Wakefield.
It should be noted that, for the most part, the regional markets that we will be referring to comprise the largest office markets outside of Central London; including Liverpool, Manchester, Birmingham, Bristol, Edinburgh, Cardiff, and more.
Some helpful commercial real estate definitions:
- Take-up – Gross leasing activity over a period of time.
- Vacancy rate – The percentage of office space that’s empty in the particular observed market.
- Availability – The amount of space in square feet that’s available for deals immediately or in the short term.
- Headline/Prime rent – Highest achievable rental price, disregarding outliers.
- Yield – The annual percentage return on investment in the form of income, compared to the initial amount spent to buy the property.
- Prime yield – The yield percentage figure when an optimal situation has been achieved with an excellent tenant occupying a Prime/Grade A building or space (after the Grade A market typical rent-free period has ended).
Q2 2022 UK Regional Office Market – At a Glance
- Take-up Levels – 1.1 million sq/ft (2.4 million sq/ft total for H1, 2022)
- Q2 take-up represented a fall of 12% against Q1.
- Despite this fall, H1 2022 saw take-up increase by 24% on H1 2021 and 20% on H1 2020.
- The business services sector is most responsible for take-up over the last year at 22%, with the Creative and Professional Industries following at 19% and 17% of take-up respectively.
- Demand for Grade A office space remains steady
- Availability – 18.5 million sq/ft (a 1% fall during the quarter)
- However, availability was still 26% above the five-year quarterly average of 14.6 million sq/ft.
- New office space supply was limited, contributing just 14% of the overall UK regional office market
- Completions – 2.0 million sq/ft YOY (65% leased at the end of Q2, 2022)
- 2022 Construction – 1.7 million sq/ft of stock is due by end of 2022
- Construction Outlook – 4.5 million sq/ft is due between 2022 and 2024 (28% of this office space is already pre-let)

The UK Office Market Continues to Recover
In the first half of 2022, the UK office market continued to strengthen and recover from the ill effects of the pandemic.
The region’s total take-up for H1 2022 was 2.4 million sq/ft. This was a 24% increase YOY, and a 20% increase over H1 2020.
Grade A office space leading the way
Grade A space accounted for 46% of the total take-up in major office markets outside of London. The 10-year average take-up rate for prime office space in the first half of the year was lower, at 41%, further expressing a continued flight to quality across the UK regions. Adding to this, resilience has been demonstrated through continued demand for Grade A office space, despite the pandemic exerting downward pressure in other market subsets.
However, due to declining levels of Grade A availability in several locales, tenants with greater needs have been waiting and weighing their options – in order to find an ideal space that effectively satisfies the unique needs of their business. Due to the current shortage of Grade A property seen across core regional markets outside of London, the market for expansive, high-end floor plates has grown significantly more competitive.
Transactions
402 deals were completed in the UK’s nine biggest markets outside of London in the first half of 2022, which was 20% more than the five-year average and a notable 33% rise over the total of 303 deals seen in the first half of 2021.
Take-up for deals under 5,000 sq/ft made up 26% of all take-up in the five years prior to the pandemic. Deals under 5,000 sq/ft accounted for an increased 36% of the total take-up in H1 2022. This demonstrates the increased importance of transactions in the lower size band going forward.
Notable leases
In the first half of 2022, there were two lettings in the regional markets of the UK that were larger than 100,000 sq/ft. These included Shell’s purchase of 100,000 sq/ft at the Silver Fin Building in Aberdeen, and the Government Property Agency’s lease of 130,000 sq/ft at First Street in Manchester.

Supply levels
Supply-wise, the total regional availability at the end of H1 2022 was 14.5 million sq/ft, roughly matching the number from Q4 2021.
In Q2 2022, supply of Grade A space fell by 14% to 4.3 million sq/ft, resulting in a shortage of premium space in core regional markets. Exemplifying the continuing shortage, there is currently less than a year’s worth of Grade A space available in Birmingham, Bristol, Leeds, and Edinburgh. Additionally, only 130,000 sq/ft of new Grade A space is currently available in Glasgow, clearly illustrating the lack of high-quality space in numerous major markets.
Rental rates
Bristol was able to achieve increased rental rates in the first half of 2022, despite previously mentioned obstacles. Currently, the prime rent in this market sits at £42.50 per sq/ft, an increase of 12% from Q4 2021 and a 10% increase YOY.
There is also still hope for rental growth in other regional markets entering the second half of the year, with forecasts for prime rents exceeding £40 per sq/ft in at least three of the UK’s largest regional markets by the end of 2022.
Hope exists for rental growth in other regional markets as we enter the tail end of the year, with forecasts for prime rents exceeding £40 per sq/ft in at least three of the UK’s biggest markets by the end of 2022.

Investment market
At the conclusion of H1 2022, office investment volumes outside Central London totalled £3.6 billion – 15% more than the long-term average. The main reason for this is the trading of multiple major assets. Additionally, the first half of the year saw nine agreements totalling more than £100 million, the second-highest number of such transactions seen in the previous ten years. A significant proportion of investor demand related directly to prime (Grade A) office stock.
In four of the last five years, foreign investors have been the most active group when it comes to regional market investment. Responsible for 49% of all investment volumes in H1 2022, this group remains highly engaged in the sector. North American investors took up the largest share for the second year in a row, making up 46% of all foreign investment.
UK property businesses followed behind as the second most active investors in the UK regional market. On the other hand, investment from UK institutions has faltered, only accounting for roughly 10% of investment since the start of 2021.
Which Regions are Succeeding and Why?
A recent market analysis from Avison Young evaluated the Q2 performance of the nine most significant office markets outside of London. This data is especially helpful in allowing assessment of the resilience of these markets against medium-term risks.
So, to get more of a detailed understanding of the way in which these markets contribute to the outlook of the entire UK, we’ve investigated their recent performances below.
Pulling together regional CRE data
After rallying post-pandemic in late 2021, take-up across the core regional office markets totalled 1.8 million sq/ft in Q2, trending downward for the second straight quarter. Manchester was the biggest contributor, despite the shortfall, accounting for more than 500,000 sq/ft of total leasing activity. Declining take-up is likely due to diminishing Grade A stock, which is failing to meet the pressure being placed on demand by the market’s perceived flight to quality.
More optimistically, investment volume increased for the third quarter in a row, with office sales totalling £850 million across core markets. The half-year total now stands at £1.6 billion, the highest investment level since 2005. Additionally, the average rental prices have increased by 5% YTD, certainly nothing to scoff at.

Birmingham Office Market
Some quick figures for Q2 2022
- CBD Take-up – 117,599 sq/ft
- Countryside/Exterior Take-up – 35,419 sq/ft
- Headline/Prime CBD Rent – £39 per sq/ft
- Headline Countryside/Exterior Rent – £26 per sq/ft
- Under Construction – 613,000 sq/ft
- Prime Yield – 5% (stable since Q2 2019)
In Birmingham, leasing activity was at 153,000 sq/ft in Q2 2022, down on figures of 260,000 sq/ft seen in Q1. The Department for Transport leased 22,900 sq ft of prime space at The Colmore Building as a key transaction.
Similar to numerous other locations, many organisations in Birmingham are unsure about how much physical office space they will need in the post-pandemic working world – as some employees continue working remotely, while others look to return to the office. As a result, many companies are looking to remain agile by occupying smaller spaces on shorter lease terms.
However, there’s expected to be more stability for flexible office providers in Q4, when businesses have a clearer idea of their individual workplace needs. In turn, this increased demand for flexibility from corporate users is anticipated to lead to an expansion of similar types of flexible spaces in the area.
Many people are choosing to rent smaller – but better quality and more centrally located – office space in the post-pandemic era. Even though the broader UK economy is not doing so well, there is still a demand for Birmingham office space, which is tipped to lead to some large transactions in the second half of the year. Investment volumes reached £282 million in Q2 and £340 million in total for H1. As a result, this was Birmingham’s strongest H1 period in five years.

Bristol Office Market
Some quick figures for Q2 2022
- CBD Take-up – 143,609 sq/ft
- Countryside/Exterior Take-up – 46,614 sq/ft
- Headline/Prime CBD Rent – £42.50 per sq/ft (a 10% increase YOY)
- Headline Countryside/Exterior Rent – £23.50 per sq/ft
- Under Construction – 675,021 sq/ft (30% pre-let)
- Prime Yield – 5% (continuing stable)
Bristol’s office market is booming, with 190,000 sq/ft of take-up in Q2 resulting in a total of 526,000 sq/ft being taken up in the first half of the year. This is higher than any other year in the past decade. The main drivers of this growth are businesses in the tech and creative sectors.
There has been an 11% increase in availability this quarter alone, but this figure shouldn’t elicit worry – positive indicators show that this will decrease soon, as sublease space has been rapidly filling up since peaking at 126,000 sq/ft earlier in the year.
472,000 sq/ft of space is currently being constructed in Bristol, with 160,000 sq/ft set to finish within the next year.
Rents are anticipated to rise at a slower rate over the next five years, with prime (Grade A) rental prices expected to continue to outperform those seen in Grade B.
In Q2, Bristol received £107 million in investment sales – totalling to £293 million for the year thus far.

Cardiff Office Market
Some quick figures for Q2 2022
- CBD Take-up – 75,524 sq/ft
- Countryside/Exterior Take-up – 16,115 sq/ft
- Headline/Prime CBD Rent – £25.00 per sq/ft
- Headline Countryside/Exterior Rent – £15.50 per sq/ft
- Under Construction – 227,000 sq/ft (53% pre-let)
- Prime Yield – 5.75% (continuing stable)
In Cardiff, 91,639 sq/ft of office space was transacted in Q2, compared to 121,275 sq/ft in Q1 2022. This brings the H1 total to 213,000 sq ft; 15% above normal. The TMT (technology, media and telecommunications) sector has continued to be the most active in 2022, with BT Group leasing 65,000 sq/ft at Capital Quarter. This large lease will accommodate 900 people in the area and will establish a strong presence for the business in Wales.
The only large building in development for 2022, the Interchange, has already been completely rented by L&G. Additionally, the only other office space scheduled to be built speculatively is JR Smart’s 106,000 sq/ft John Street scheme, set to be completed at the end of 2023. This past quarter saw little activity in Cardiff’s office investment market, with a total of only £7.5 million being traded.

Edinburgh Office Market
Some quick figures for Q2 2022
- CBD Take-up – 50,834 sq/ft
- Countryside/Exterior Take-up – 45,807 sq/ft
- Headline/Prime CBD Rent – £39.00 per sq/ft
- Headline Countryside/Exterior Rent – £29.00 per sq/ft
- Under Construction – 390,000 sq/ft (100% pre-let)
- Prime Yield – 4.75% (stable, but the lowest of the Big 9)
In Edinburgh, there was 97,000 sq/ft of office take-up during the second quarter of 2022, which is a decrease of 17% from Q1. The professional services industry accounted for 60% of take-up due to several notable lease events.
Availability has increased to 19% over the past quarter, which may be explained by a few key occupants releasing space back on the market. Despite increasing over this period, availability remains 17% below long-term averages. This has resulted in relatively tight supply for renters looking for Central Edinburgh office space within a Grade A setting.
The two new build schemes under construction in Edinburgh – 1 Haymarket and 2/3 Haymarket – have both been fully pre-let. The 390,000 sq/ft of space due to be provided by these projects quickly became desirable due to the lack of larger floor plates being marketed downtown.
The fact that there is less high-quality space available has pushed prime headline rents in Edinburgh to £39 per sq/ft (an increase of 3% over Q1 2022). Additionally, the typical rent-free period on a 10-year lease has dropped from 15 to 12 months. While take-up may decrease as the economy deteriorates, existing supply restrictions – especially for prime locations – are expected to support rental price growth in Edinburgh.
This quarter, Edinburgh’s office space investment saw about the same level of activity as it has for the last 10 years, with transactions totalling £88.6 million. An uptick in investors buying buildings outside of the downtown area has been noted, with most aiming to renovate these spaces to take advantage of office demand from businesses that can’t find space in the busier, highly sought-after areas.
Glasgow Office Market
Some quick figures for Q2 2022
- CBD Take-up – 130,655 sq/ft
- Countryside/Exterior Take-up – 32,011 sq/ft
- Headline/Prime CBD Rent – £35.25 per sq/ft
- Headline Countryside/Exterior Rent – £16.50 per sq/ft
- Under Construction – 1,130,000 sq/ft (81% pre-let)
- Prime Yield – 5% (stable since 2018)
In the second quarter of 2020, Glasgow saw an increase of 25% in transactions with a total of 131,000 sq/ft being leased. Although this is higher than the previous quarter, it is still 30% lower than the 10-year average.
The professional sector had the highest take-up rate (38%), followed by the manufacturing and industry sectors (22%). Decisions regarding leasing were largely driven by Glasgow’s high level occupancy tied to professional and financial services, as well as delayed lease events due to pandemic-induced lockdowns.
As occupiers increasingly seek out net-zero buildings, rental growth for the most sustainable Grade A offices in Glasgow is expected to increase. It is anticipated that, as the role of office spaces continues to shift, more occupiers will look to move into Glasgow’s city centre in order to create a stronger brand identity and attract their employees back into the workplace. This is predicted to gain momentum as we reach the end of the year and continue throughout 2023.
Investment in Glasgow offices rose to £26 million in Q2 2022, which is consistent with previous 10-year averages. The investment total of £241 million seen in the first half of the year was considered an outstanding result. Major events, such as Pontegadea buying HFD Group’s flagship project at 177 Bothwell Street for more than £200 million, largely accounted for these bumper figures.
Leeds Office Market
Some quick figures for Q2 2022
- CBD Take-up – 147,047 sq/ft
- Countryside/Exterior Take-up – 54,331 sq/ft
- Headline/Prime CBD Rent – £34.00 per sq/ft (stable for the fourth consecutive quarter)
- Headline Countryside/Exterior Rent – £24.75 per sq/ft
- Under Construction – 766,205 sq/ft (13% pre-let)
- Prime Yield – 5.25% (continuing stable)
In Q2 2022, Leeds saw the purchase of approximately 201,000 sq/ft of office space, which was lower than expected. The year-to-date total is just over 430,000 sq/ft, modestly below expectations, though aligned with recent averages for this time of the year. Around 70% of Q2 take-up occurred via the public and professional services sectors.
Availability reached 1.2 million sq/ft – Leeds’ fifth consecutive quarterly increase. Although this is good news, it’s important to keep in mind that these levels are still below average when compared to the last 10 years. Overall, availability rates are down 7.2%. Additionally, there has been a significant uptick in sublet space (110,000 sq/ft), which is now double the pre-COVID average from 10 years ago.
In terms of construction and investment, there is currently 609,000 sq/ft of speculative space being constructed in Leeds, which is set to finish across 2022 and 2023. On a 10-year lease term, typical rent-free periods remained at 24 months, compared to the average of 4 months seen across other core regional markets. In Q2 2022, investment volumes were at £92 million, surpassing long-term average levels of £60 million.
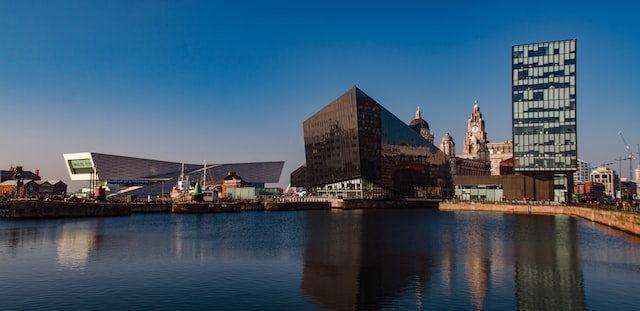
Liverpool Office Market
Some quick figures for Q2 2022
- CBD Take-up – 70,024 sq/ft
- Countryside/Exterior Take-up – 55,944 sq/ft
- Headline/Prime CBD Rent – £25.00 per sq/ft (up 13% YOY)
- Headline Countryside/Exterior Rent – £16.50 per sq/ft
- Under Construction – Nil
- Prime Yield – 5.75% (stable, and above Big 9 5.28% average)
In the second quarter of 2022, 554,000 sq/ft of office space was leased in Liverpool, bringing the H1 total to 207,000 sq/ft and keeping it at around 10-year average levels. Financial businesses accounted for one-third of take-up in H1, with those in government and services sectors accounting for 17%.
Last quarter’s availability of 554,000 sq ft, which is slightly higher than the same period a year ago, remains relatively stable in Q2 with an increase of only 1% over the previous 12 months. Liverpool’s lack of new construction in the pipeline is having a dampening effect on availability.
Prime rents have increased by 13% in the past year to £25 per sq/ft, which is much higher than the percentage growth seen in other parts of the country. The main reason for this increase stems from a lack of office building construction, as well as the fact that many existing buildings are in the process of being refurbished.
It’s expected that prime rents will continue to increase as there is no new stock being delivered, amid strong demand from those wanting to occupy Grade A space. In Q2, £33 million worth of investment deals were transacted, 22% higher than the average over the past 10 years.
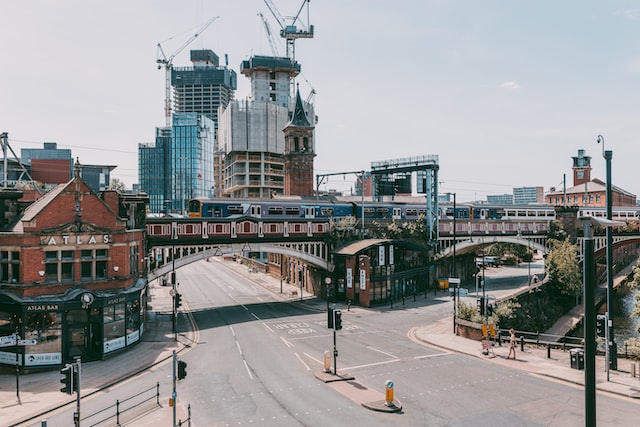
Manchester Office Market
Some quick figures for Q2 2022
- CBD Take-up – 251,429 sq/ft
- Countryside/Exterior Take-up – 260,683 sq/ft
- Headline/Prime CBD Rent – £39.50 per sq/ft
- Headline Countryside/Exterior Rent – £24.00 per sq/ft
- Under Construction – 955,000 sq/ft (32% pre-let)
- Prime Yield – 4.75% (joint lowest with Edinburgh)
Manchester’s Q2 take-up rate of 512,112 sq/ft is keeping steady with the year’s trends so far. H1 total take-up is only 2% under the average for the last 10 years. CBD availability fell 6%, although it remains 15% above 10-year average levels. Rent-free periods on 10-year deals remain at 24 months, while 5 to 9-year deals are still receiving 9-12 months rent-free offers. The popularity of plug-and-play spaces continues, as they achieve £5 per sq/ft premiums on suites larger than 5,000 sq/ft.
Of the 650,000 sq/ft of available space currently under speculative construction in Manchester, BT and GPA’s pre-let deals at 4 New Bailey and First Street respectively add 350,000 sq/ft to the total development pipeline. Given the city’s strong occupational market, it’s anticipated that this new high-quality space will help maintain continued prime rental growth.
In Q2, prime rents increased to £39.50 per sq/ft and are predicted by many to reach at least £40 by year’s end because of the continued fervent demand for high-quality spaces with exceptional ESG credentials. Also, throughout the Manchester market, occupiers continue their search for top quality space – 42% of all city centre deals in Q2 were Grade A.
In Manchester, there was £191 million worth of investment deal transactions in Q2, 15% more than the 10-year average. However, like most major UK regional markets today, agents have reported a drop in activity due to current economic conditions, such as rising interest rates and inflation.

Newcastle Office Market
Some quick figures for Q2 2022
- CBD Take-up – 49,808 sq/ft
- Countryside/Exterior Take-up – 195,711 sq/ft
- Headline/Prime CBD Rent – £27.50 per sq/ft (6% higher YOY)
- Headline Countryside/Exterior Rent – £16.95 per sq/ft
- Under Construction – 190,000 sq/ft
- Prime Yield – 6.25% (best performing in UK’s regional market)
In the second quarter of 2022, 256,000 sq/ft of office space changed hands in Newcastle. This brought the total for the first half of the year to 443,000 sq/ft – almost one-third above the 10-year average.
38% of take-up was from the professional services sector, whilst 28% came from the consumer and private services sectors. Availability rose 20% after having fallen in recent quarters, now aligned with levels 12 months ago. Subletting levels, however, remained consistent with those of last quarter.
120,000 sq/ft of new office space is being built in Newcastle and will be completed by 2023, all housed at Bank House. The city has a development pipeline of 190,000 sq/ft under construction. This is 15% lower than the average deliveries over the past 10 years and will continue to drive up scarcity and prime rents.
In Q2, £23 million worth of investment deals were transacted in Newcastle – slightly lower than the 10-year average, but higher than any quarter since Q4 of 2020.

Outlook for the UK Regional Office Market
Many businesses are rethinking their office spaces to adapt to changes in the UK employment market brought on by the rise of remote work and popularity of hybrid working models. This may mean making changes like downsizing, upsizing, or switching to a different type of space that has more amenities to increase productivity, retention and attract top talent.
ESG-certified office assets have generated a high level of investor interest. However, these sorts of properties are in short supply, owing to their significant ESG credentials alongside a number of additional attractive Grade A qualities. The increasing cost of debt and an unstable macroeconomic situation, on the other hand, are putting upward pressure on prime yields.
Best-in-class buildings are flourishing, making predictions of the death of the office continue to appear baseless. Beyond such top-tier buildings, however, the situation is more ambiguous. Existing pressures were revealed by COVID-19, and the emergence of hybrid models and the general flight to quality will continue to prompt changes to occupant expectations.
Did you find this article helpful? Do you have any tips you’d like to add? If so, reach out to us through our social channels on Facebook and Twitter.
Also, if you’re looking for flexible workspace across the UK you can view our competitive solutions in Central London, Greater London, the North, and the South. You can also call one of our commercial property experts on 020 3970 9731.
Looking for more articles?
You can visit the links below to find more workplace insights.
28 Clever Ways to Organise Your Desk for Maximum Efficiency
Rising Demand in the UK Flexible Office Space Market
How Long is Maternity Leave in the UK? A Full Guide
10 Common Employee Misconceptions in the Workplace and How to Avoid Them
5 Things That UK Employees Want in an Office Environment
Average Office Worker Salary UK: How Does Your Job Stack Up?
Top Ten Industries in the UK
The Step-by-Step Ultimate Office Move Checklist for 2022